


Prototype investment
strategies online...
strategies online...


The menu bar on top
of the main window
contains the main
prototyping, risk
analysis and portfolio
optimization functions
as well as buttons for
the administration of
the portfolio
The center of the main
window contains
the position table,
which can be displayed
at different aggregation
levels (book view, flat
view), different column
views and which can
be filtered according to
asset and instrument
classes.
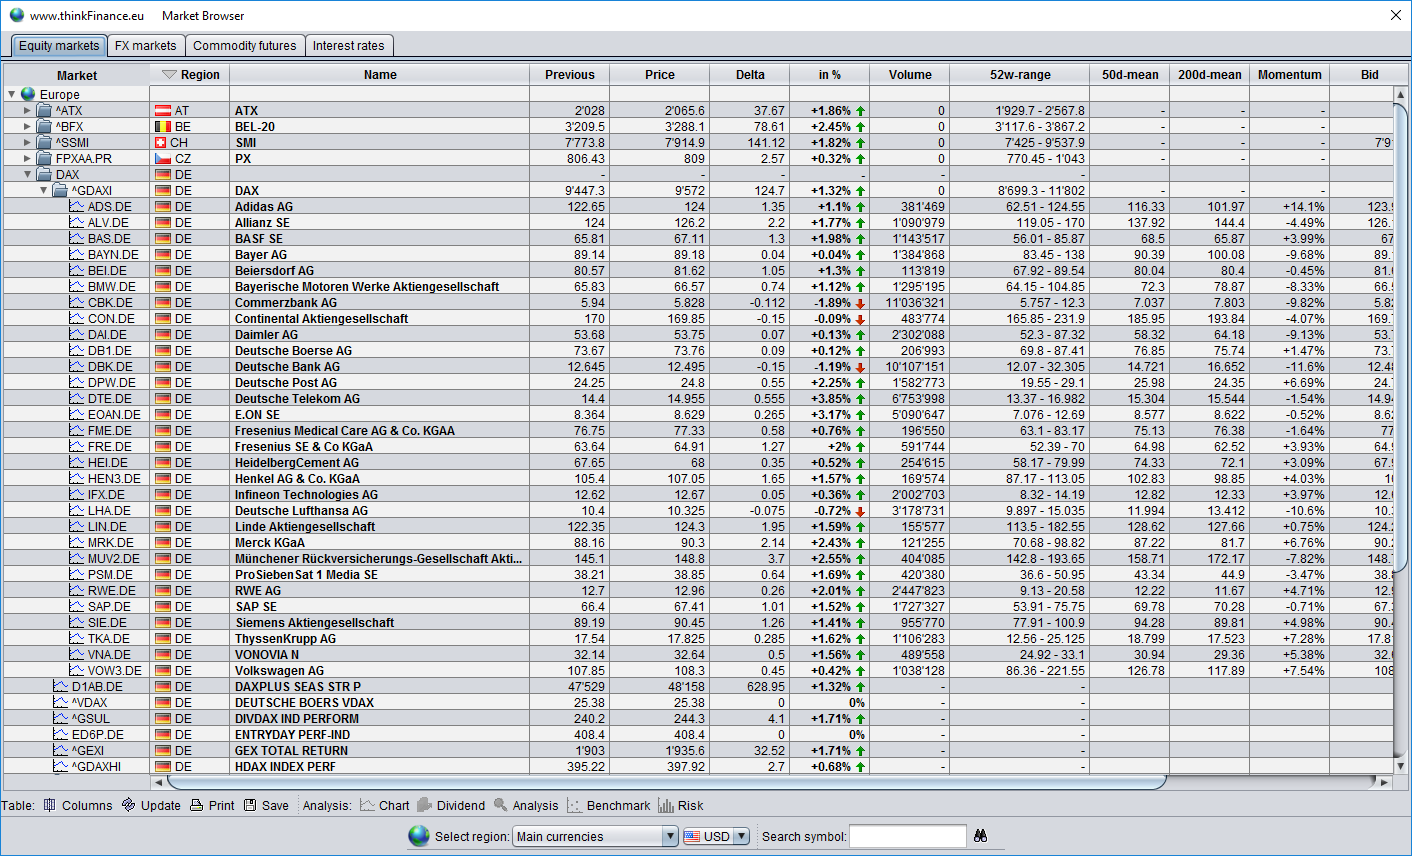
The user can either
compare the intra-day
performance of major
equity indices and drill
into one of the indices to
view the performance
of the shares contained
in the index.
The table can be sorted
with respect to all
columns.
compare the intra-
equity indices and drill
into one of the indices to
view the performance
of the shares contained
in the index.
The table can be sorted
with respect to all
columns.
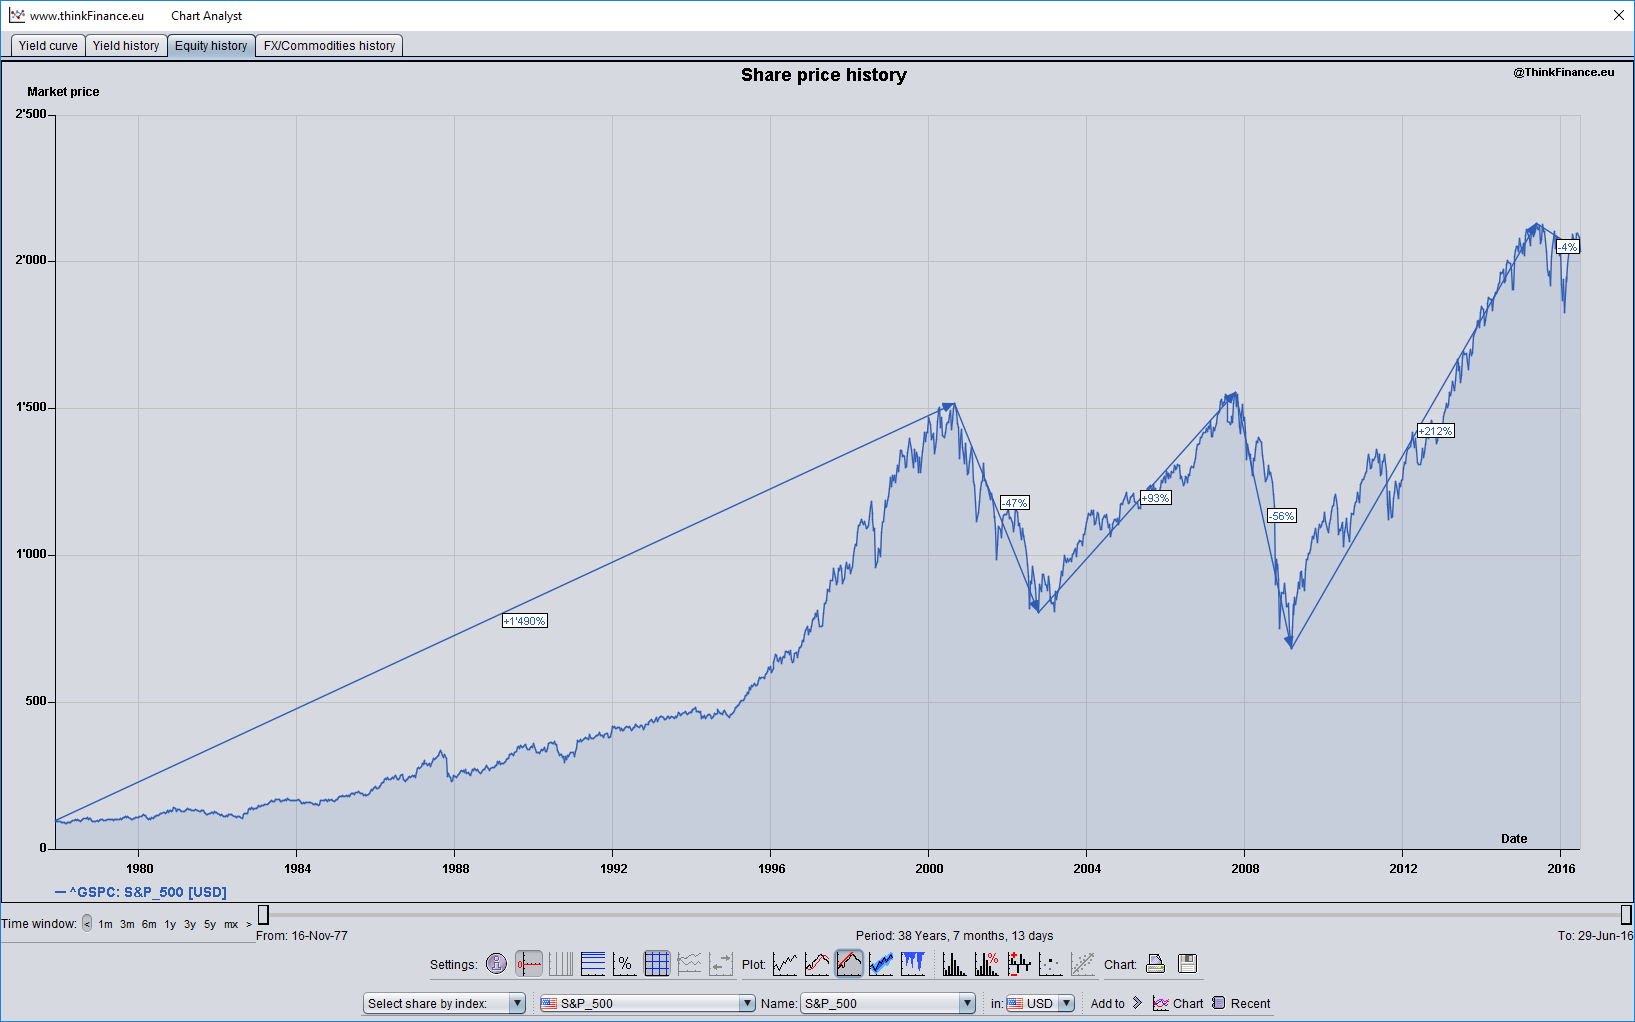
Historical market data
from the ThinkFinance
database can be plotted
and analyzed in various
ways (e.g. plot the
time series, plot a
histogram of absolute
or relative returns, plot
in different currencies,
analyze trends etc.).
from the ThinkFinance
database can be plotted
and analyzed in various
ways (e.g. plot the
time series, plot a
histogram of absolute
or relative returns, plot
in different currencies,
analyze trends etc.).
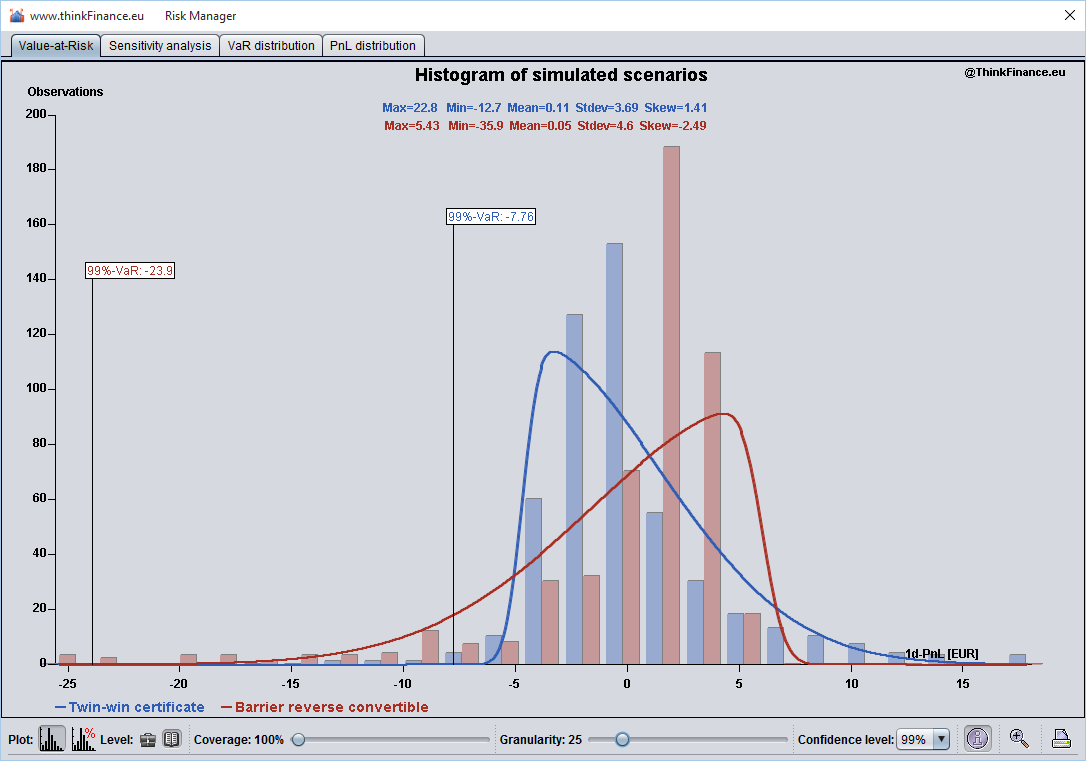
The VaR plot shows the
profit and loss
distribution calculated
using a historical
simulation and
the VaR at the chosen
confidence level.
The user can adjust the
granularity of the plot
(i.e. number of buckets)
and zoom into the tail
of the distribution.
The VaR plot can be
performed for a single
position or at a book or
portfolio level.
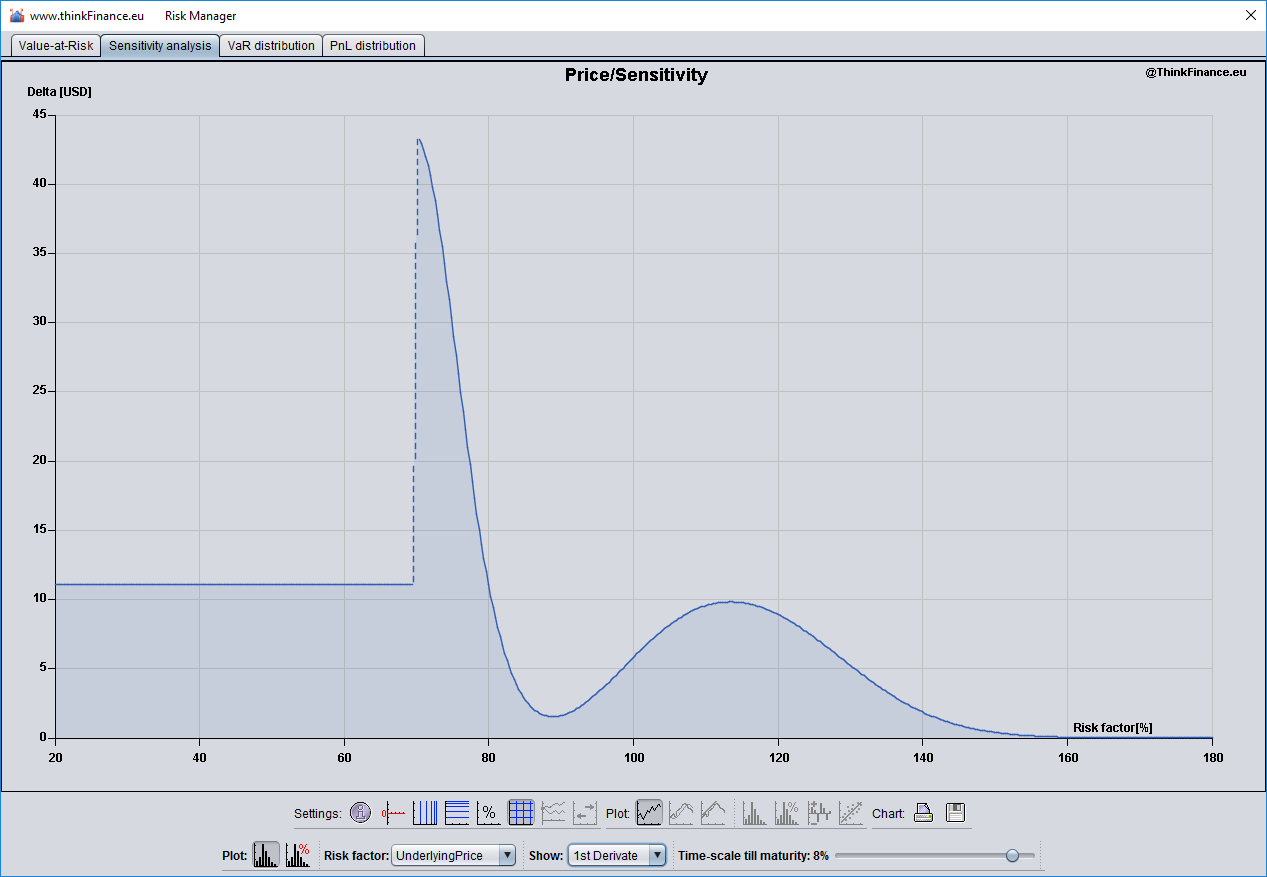
The sensitivity plot
shows the price or
„Greeks“ of a single
derivative or a book /
portfolio as a function
of a user-defined risk
factor.
The user can shift the
maturity to assess the
time-behavior of the
derivative structure.
shows the price or
„Greeks“ of a single
derivative or a book /
portfolio as a function
of a user-
The user can shift the
maturity to assess the
time-
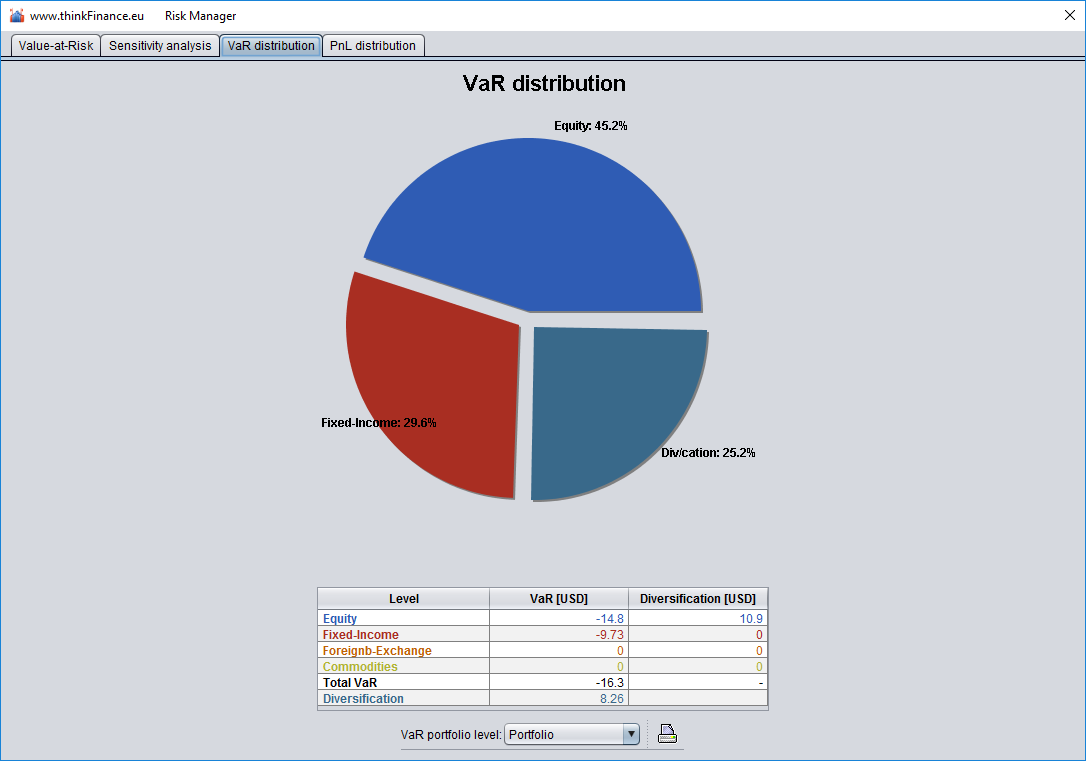
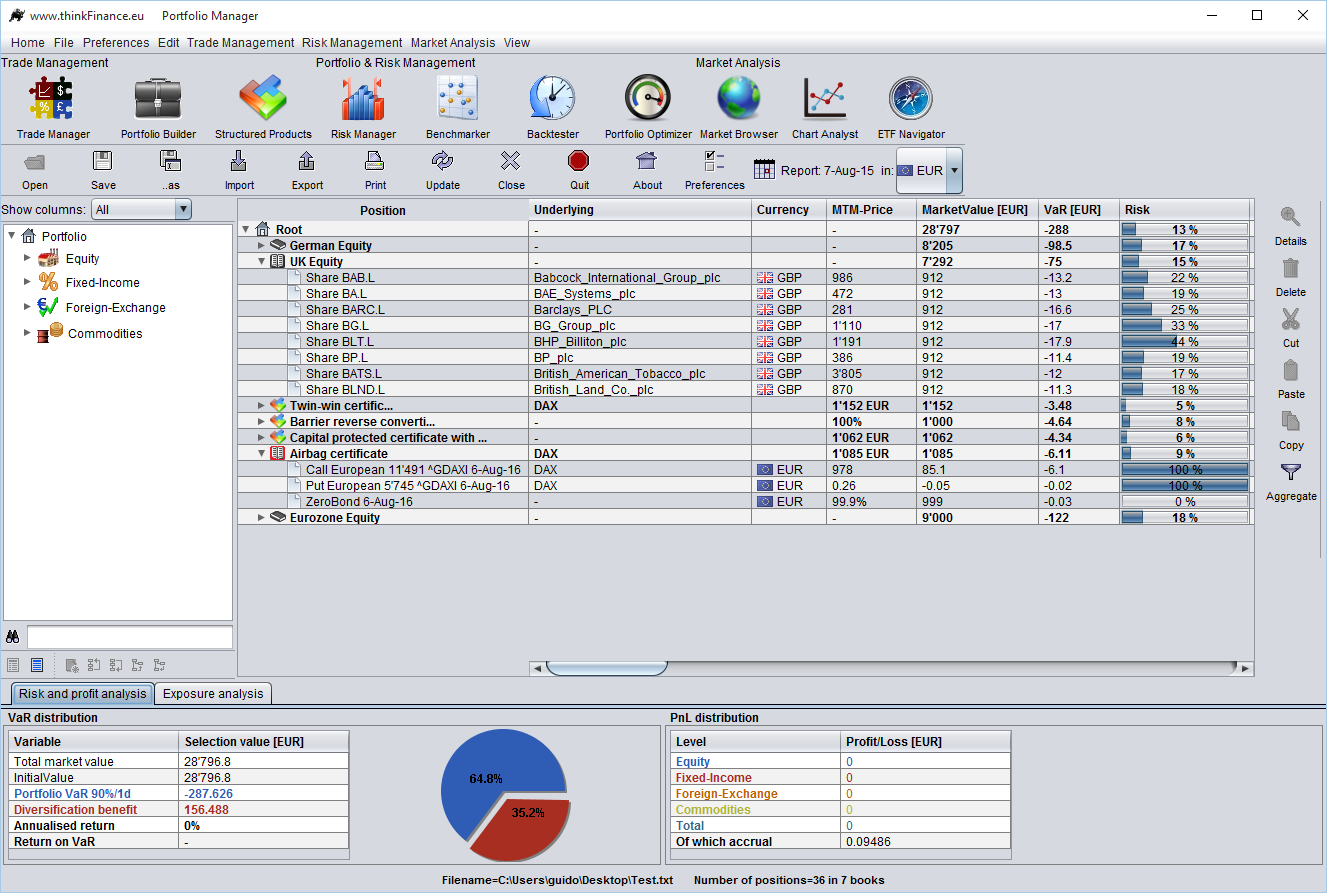
The VaR distribution
plot shows the
distribution of VaR over
assets classes or
instrument types.
Further, the user
can assess diversifi-
and across assets /
instrument classes.
The plot can be perfor-
(sub-)portfolio level.
plot shows the
distribution of VaR over
assets classes or
instrument types.
Further, the user
can assess diversifi-
and across assets /
instrument classes.
The plot can be perfor-
(sub-
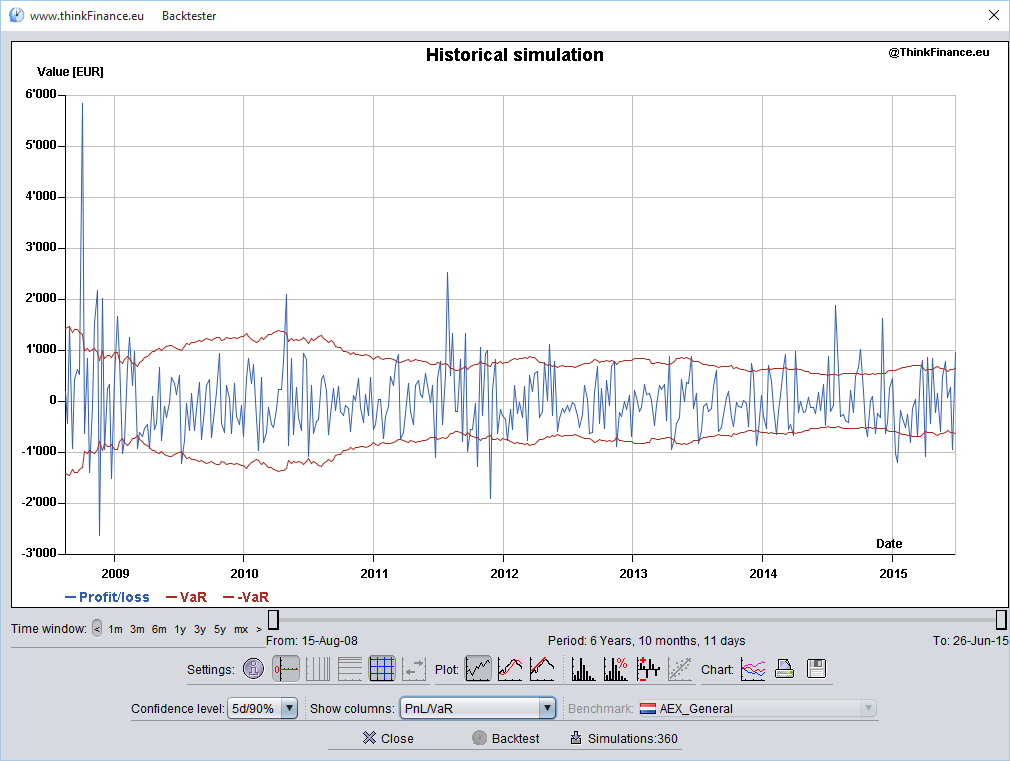
The user can calculate
the evolution of the
market value, profit and
loss and VaR over time
and can plot one of
the following:
- PnL versus VaR
- the ratio of market
value over VaR
- the evolution of
market value and VaR
the evolution of the
market value, profit and
loss and VaR over time
and can plot one of
the following:
-
-
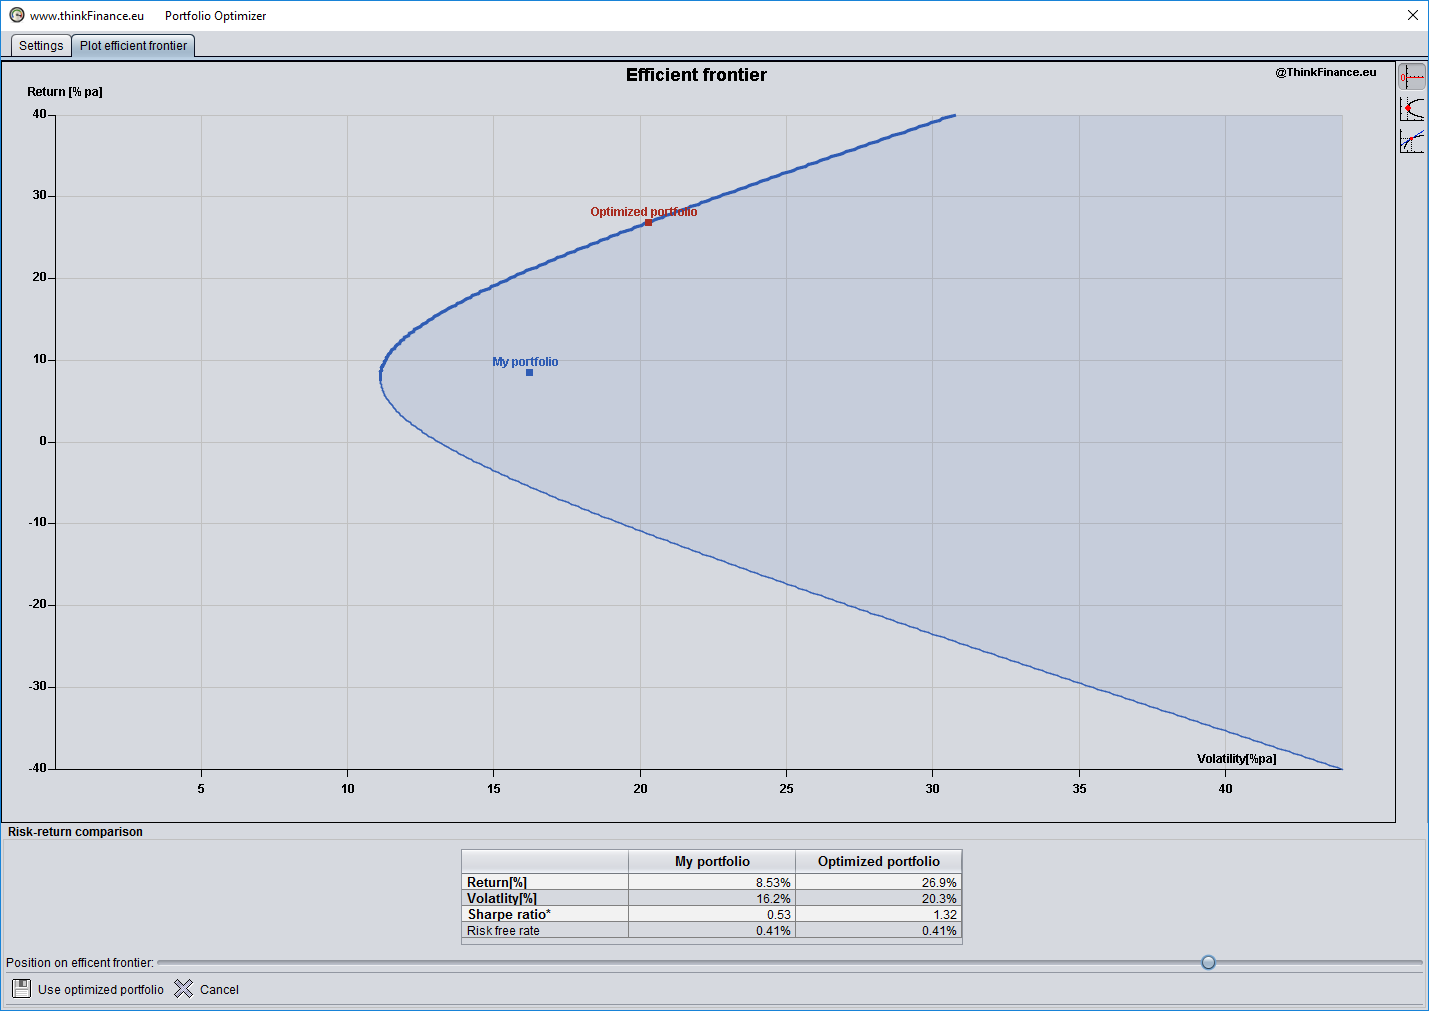
ThinkFinance calculates
and plots the efficient
frontier of the portfolio
and displays the actual
portfolio and the
efficient curve in a
return-volatility chart.
The user can select a
point on the efficient
frontier, which is then
fisplayed in detail in the
table view below.
The optimization can be
performed at a single
position level or book
level.
and plots the efficient
frontier of the portfolio
and displays the actual
portfolio and the
efficient curve in a
return-
The user can select a
point on the efficient
frontier, which is then
fisplayed in detail in the
table view below.
The optimization can be
performed at a single
position level or book
level.
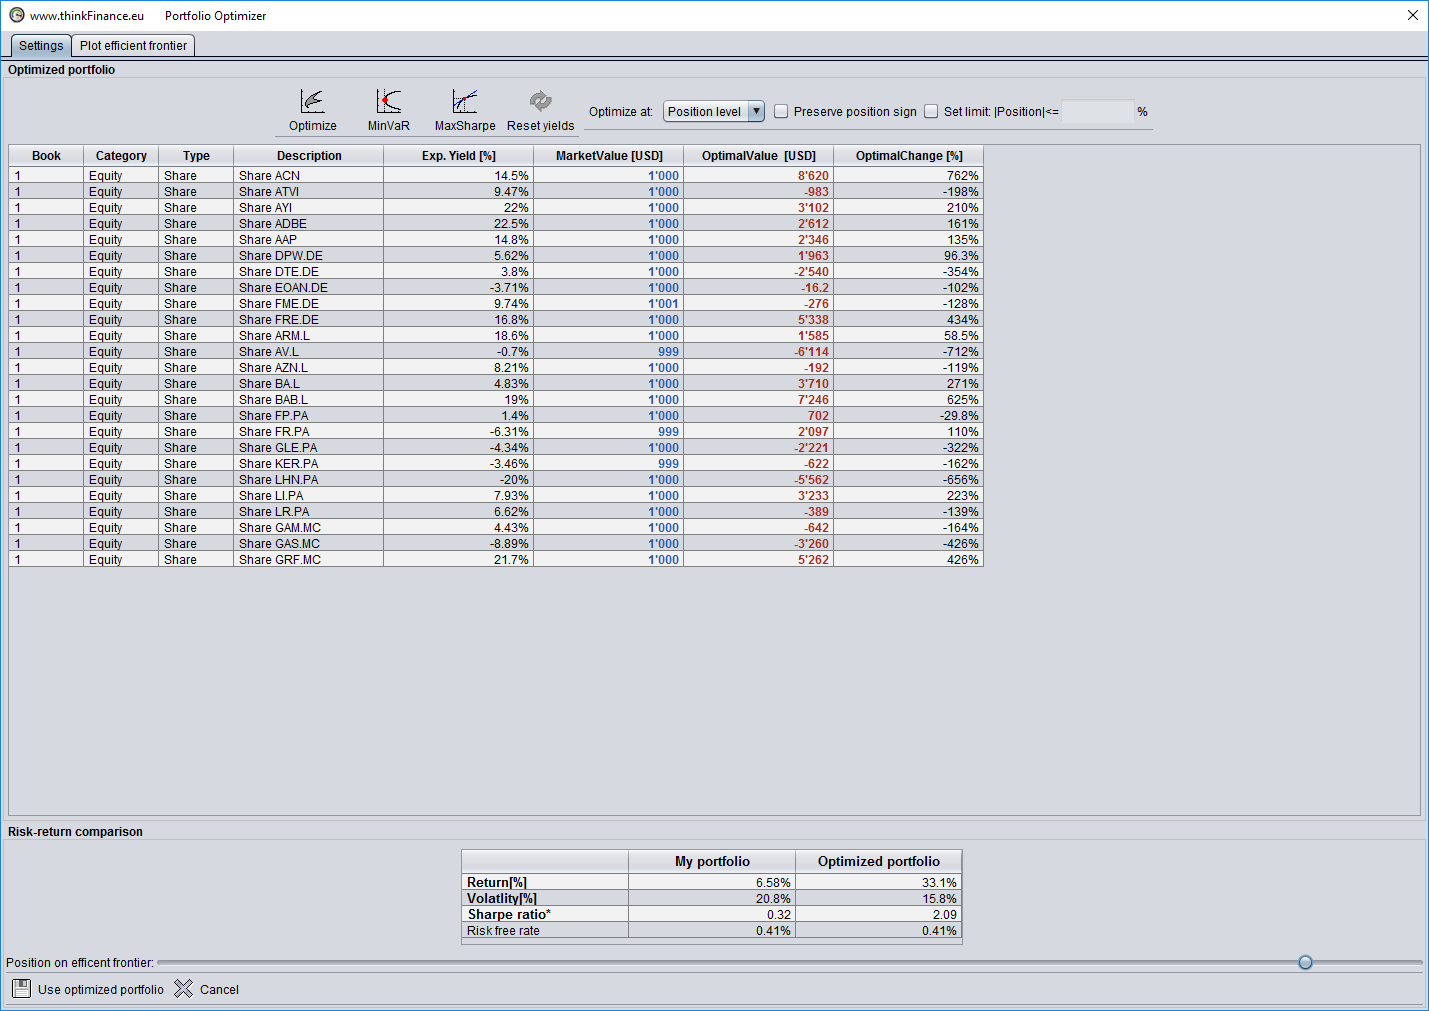
For the selected point
on the efficient frontier,
ThinkFinance compares
the asset allocation
of the actual and the
chosen (optimal)
portfolio in the upper
table.
In the lower table, the
return, the volatility and
the Sharpe-ratio of the
actual and optimal
portfolio are compared.
on the efficient frontier,
ThinkFinance compares
the asset allocation
of the actual and the
chosen (optimal)
portfolio in the upper
table.
In the lower table, the
return, the volatility and
the Sharpe-
portfolio are compared.

Learn more about
ThinkFinance
ThinkFinance
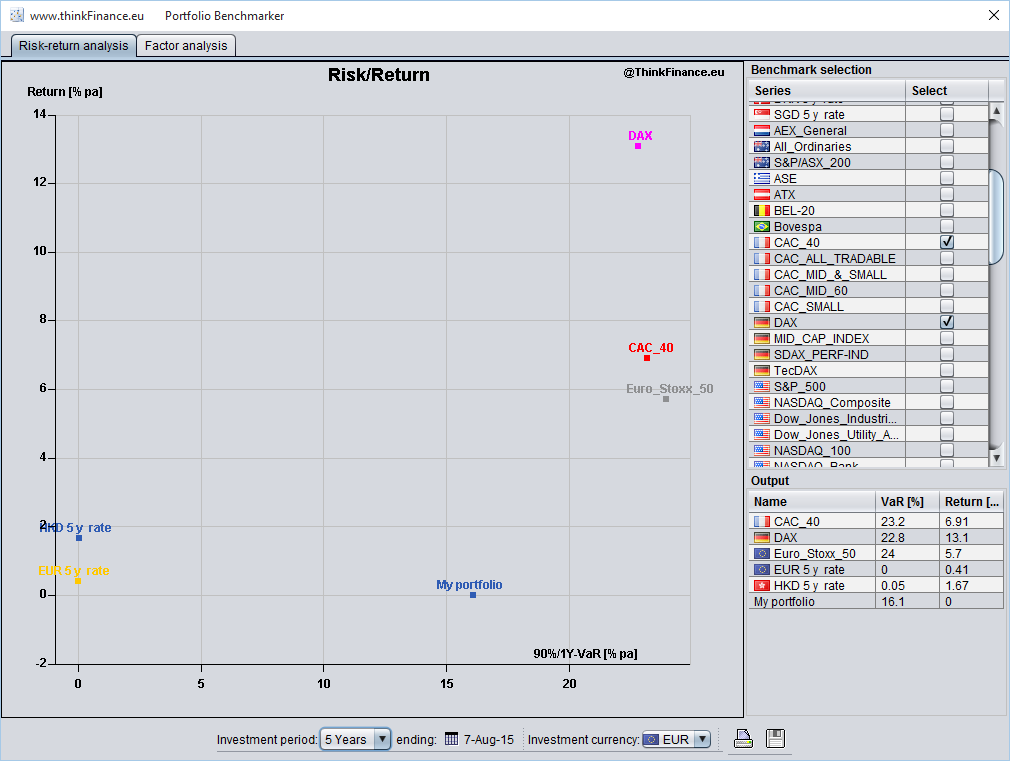
The performance and
risk (VaR) of the user´s
portfolio can be bench-
Fixed-Income indices,
based on historical
market data.
The user can select the
time horizon of the
analysis and the
base currency of the
comparison.
risk (VaR) of the user´s
portfolio can be bench-
Fixed-
market data.
The user can select the
time horizon of the
analysis and the
base currency of the
comparison.
ThinkFinance Portfolio Manager is an application you can download for free.
The following page illustrates the application's prototyping, portfolio simulation,
risk analysis and portoflio optimization functions.
The following page illustrates the application's prototyping, portfolio simulation,
risk analysis and portoflio optimization functions.
For details please refer to the instructions of ThinkFinance.
Quick tour through Think Finance
ThinkFinance Portfolio Manager offers a wide range of functions to prototype,
analyze and optimize investment strategies and to analyze financial markets -
take quick tour!
The Portfolio Manager is a versatile toolkit to build, simulate and analyze portfolios of
investments in all asset classes. In brief, Portfolio Manager allows you to:
• Manage positions in a user-defined hierarchy of books and products
• Build portfolios by drag & dropping shares, ETFs etc.
• Run historical backtests and historical Value-at-Risk calculations
• Run portfolio optimization to create MinVaR or optimal Sharpe-ratio portfolios
• Portfolio benchmarking and risk factor analysis
ThinkFinance Portfolio Manager offers a wide range of functions to prototype,
analyze and optimize investment strategies and to analyze financial markets -
The Portfolio Manager is a versatile toolkit to build, simulate and analyze portfolios of
investments in all asset classes. In brief, Portfolio Manager allows you to:
• Manage positions in a user-
• Run historical backtests and historical Value-
(click on picture to enlarge)
(click on picture to enlarge)
The Chart Analyst provides a variety of plot functions for time series analysis.
(click on picture to enlarge)
(click on picture to enlarge)
The Risk Manager calculates the risk sensitivity of a derivative:
(click on picture to enlarge)
The Risk Manager analyzes diversification benefits in your porfolio:
(click on picture to enlarge)
The Backtester runs a historical simulation of a position or a portfolio, which is
based on a full weekly re-
Top
4. PORTFOLIO OPTIMIZATION
The Portfolio Manager offers various functions to benchmark and optimize
your investment portfolio across asset classes.
The Benchmarker runs a risk-
(click on picture to enlarge)
The Portfolio Optimizer calculates the efficient frontier and optimized asset allocation
of the portfolio based on the approach of Harry Markowitz.
Efficient frontier pane:
of the portfolio based on the approach of Harry Markowitz.
Efficient frontier pane:
(click on picture to enlarge)
Optimizer pane:
1. ANALYZE FINANCIAL MARKETS
Analyze market data for Equity, Fixed-Income, FX and Commodities to spot
long-term trends or to profit from short-term market movements.
The ThinkFinance MarketBrowser summarizes the current state of equity,
fixed-income, FX and commodity markets in four summary panes.
Analyze market data for Equity, Fixed-
The ThinkFinance MarketBrowser summarizes the current state of equity,
fixed-
3. RISK AND RETURN ANALYSIS
Analyze the Value-at-Risk, the profit and loss and price sensitivity of positions,
books and portfolios.
The Risk Manager allows you to calculate the Value-at-Risk distribution:
Analyze the Value-
The Risk Manager allows you to calculate the Value-
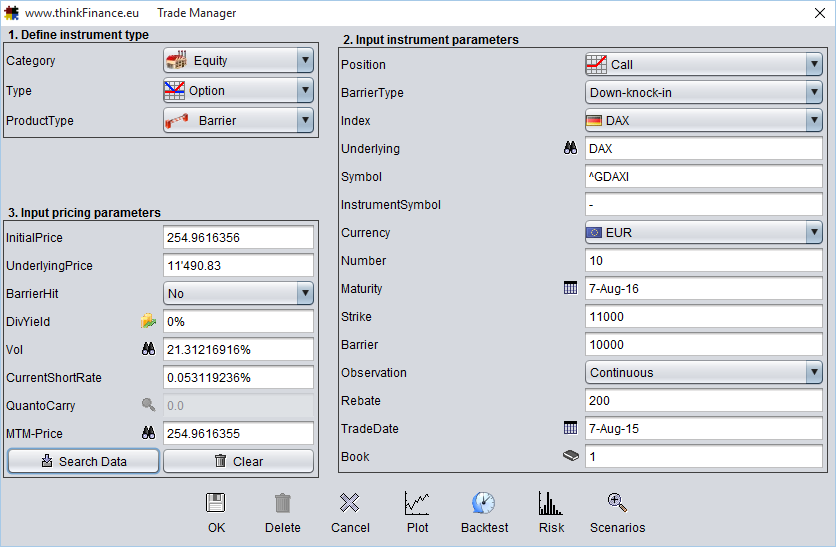
New positions require
three types of input:
In the first pane, the
user selects the asset
class and instrument
type from various
menus.
In the second pane, the
static parameters for
the selected instrument
have to be input.
In the third pane, the
user can enter market
parameters manually or
retrieve market data for
pricing the instrument.
Once all position
parameters have
been input, the user
can analyze the risk
and sensitivity of the
position regarding its
underlying risk factors.
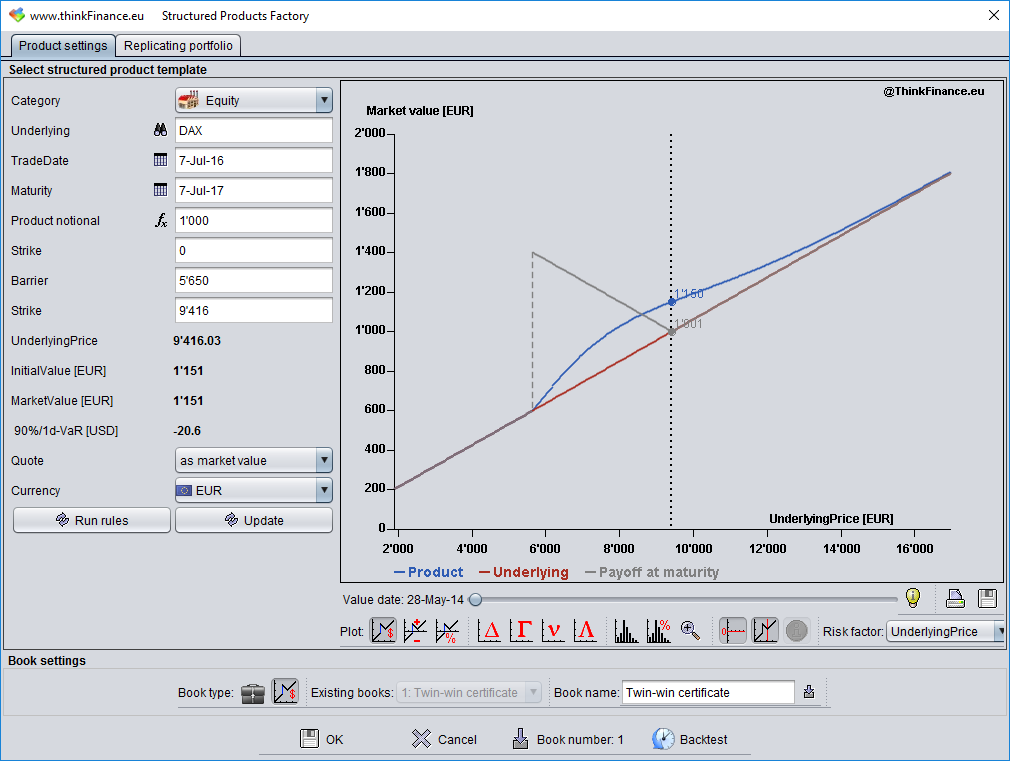
Structured investment
products are made of
various financial
instruments.
To faciliate the use of
these complex products,
the user can enter
structured products
through pre-defined or
user-defined templates.
Each product template is
defined by a replicating
portfolio and replication
rules defined in a rule
modeler.
three types of input:
In the first pane, the
user selects the asset
class and instrument
type from various
menus.
In the second pane, the
static parameters for
the selected instrument
have to be input.
In the third pane, the
user can enter market
parameters manually or
retrieve market data for
pricing the instrument.
Once all position
parameters have
been input, the user
can analyze the risk
and sensitivity of the
position regarding its
underlying risk factors.
Structured investment
products are made of
various financial
instruments.
To faciliate the use of
these complex products,
the user can enter
structured products
through pre-
Each product template is
defined by a replicating
portfolio and replication
rules defined in a rule
modeler.
(click on picture to enlarge)
(click on picture to enlarge)
The Structured Products Factory is a toolkit to define templates for structured
products, using the concept of a replicating portfolio and replication rules defined in a
sophisticated rule modeler. It also offers a wide range of simulation and risk analsis
functions.
2. PROTOTYPE INVESTMENT IDEAS
The Trade Manager is the tool to define or modify positions in securities, ETFs, FX,
commodities and derivatives:
The Trade Manager is the tool to define or modify positions in securities, ETFs, FX,
commodities and derivatives: